What is Course Analytics?
Course Analytics allows instructors to track and analyze what students, observers, and/or designers are doing with the course.
Learn more: What is Course Analytics?
Course Analytics is available to all Instructors, TAs with gradebook access, and Graders, in a Canvas course. The data available in Course Analytics can be seen in both a chart or a data table.
How do I access Course Analytics?
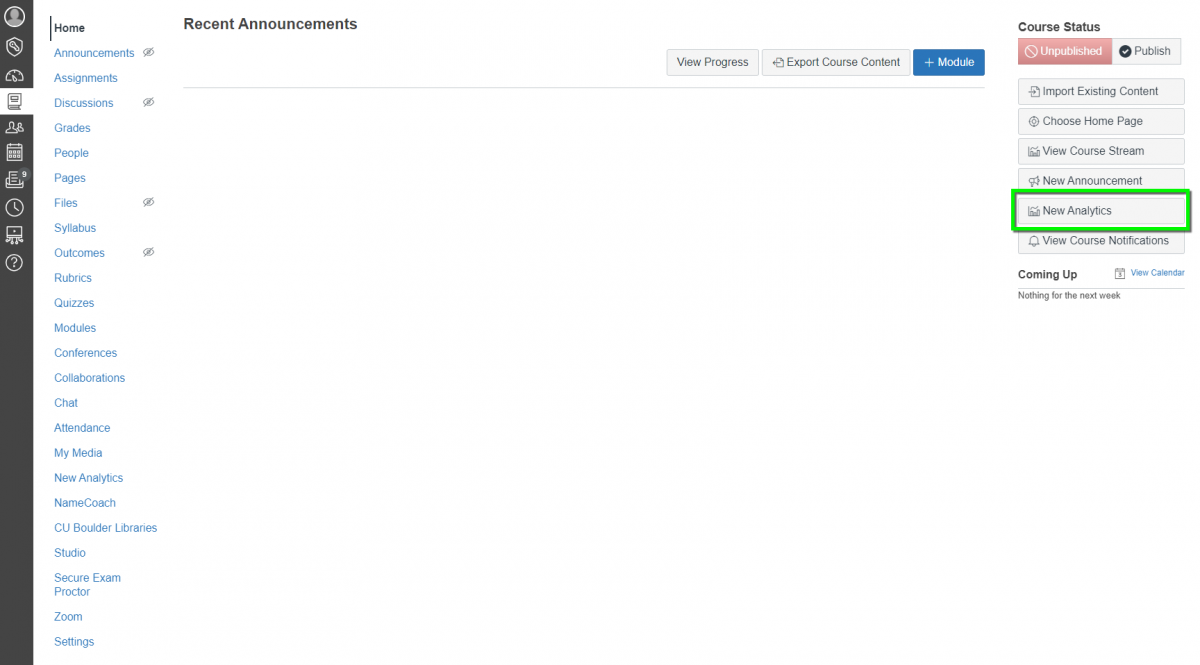
To access Course Analytics, click on the Course Analytics button from your course Home Page.
What can I see in Course Analytics?
View the average course grade:
- How do I view average course grade analytics in an interactive chart graph?
- How do I view average course grade analytics in a data table?
Compare the course average with an individual assignment, a specific course section, or a specific student:
View average weekly online participation analytics:
- How do I view weekly online activity analytics in an interactive chart graph?
- How do I view weekly online activity analytics in a data table?
Compare the course average weekly online participation analytics with an individual student or section:
Send a message to all or individual students based on specific course grade or participation criteria:
- How do I send a message to all students based on specific course criteria?
- How do I send a message to an individual student based on specific course participation criteria?
View course grade and participation analytics for an individual student:
View and download CSV reports on missing assignments, late assignments, excused assignments, the class roster, and course activity:
What is a Participation?
Canvas defines a participation as the following:
- Posts a new comment to an announcement
- Submits an assignment
- Loads a collaboration
- Joins a web conference
- Posts a new comment to a discussion
- Creates a Page
- Starts taking a quiz
- Submits a quiz
Contact Us
If you have any questions don't hesitate to contact the IT Service Center at oithelp@colorado.edu or 303-735-4357.