
Overview
Analytic reports give instructors a visual representation of who has watched presentations, the platforms they used and other helpful data. Use this guide to learn about the features of Classroom Capture analytics.
Getting Started
Analytic report links will be sent when you schedule Classroom Capture. After visiting the link, run a report for All Dates or a Custom Range of your presentations. For detailed instructions on running and saving reports, visit the Run Analytic Reports tutorial.
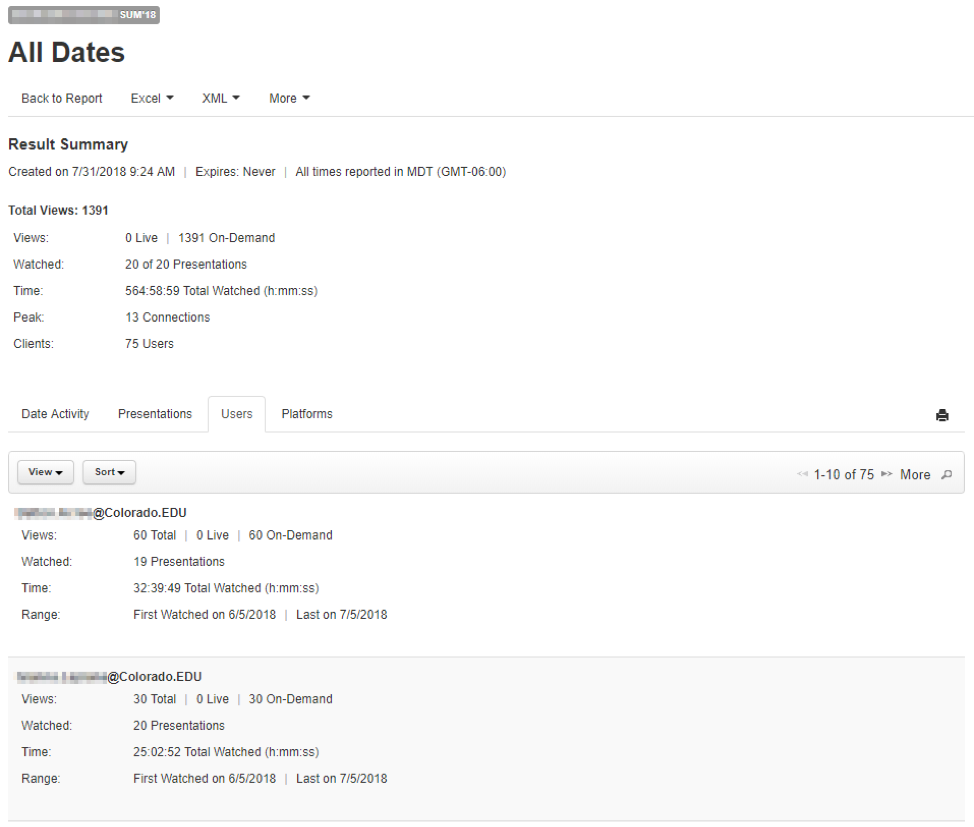
Result Summary
After saving your report, your default view is the Result Summary where you can quickly see basic stats, download the report, and navigate to different views of analytics.
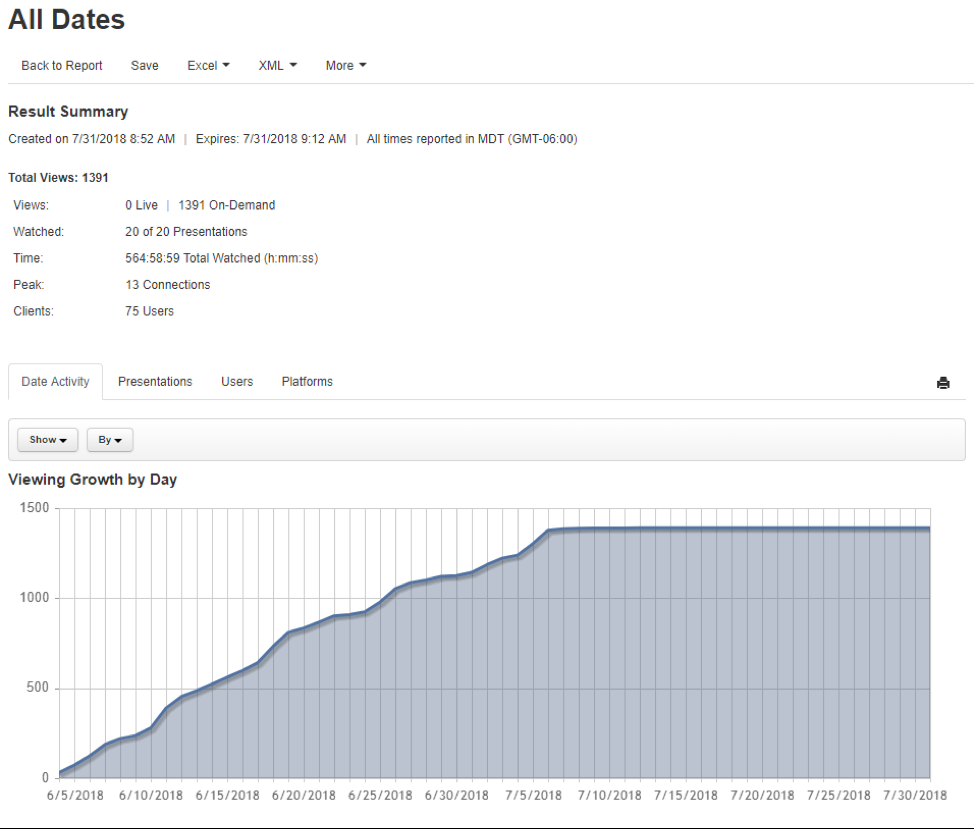
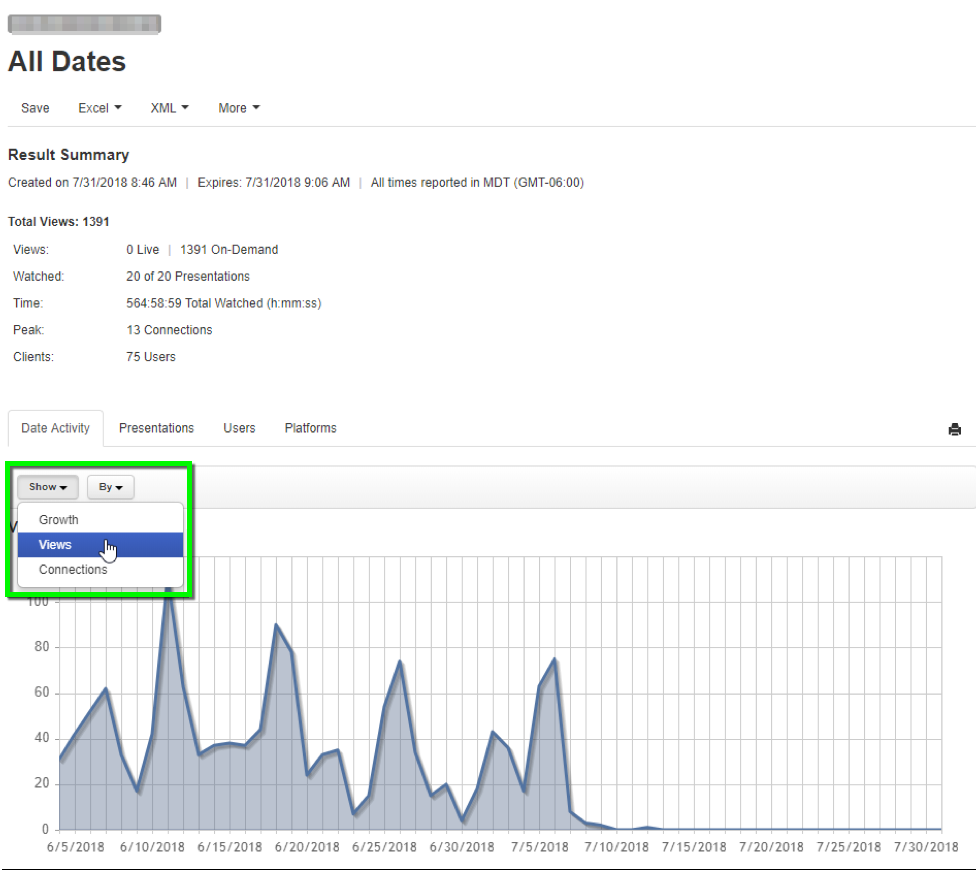
Date Activity
The Date Activity tab defaults to displaying viewing growth per day. You can click the Show and By dropdown menus to change what information is displayed (e.g. Views or Connections).
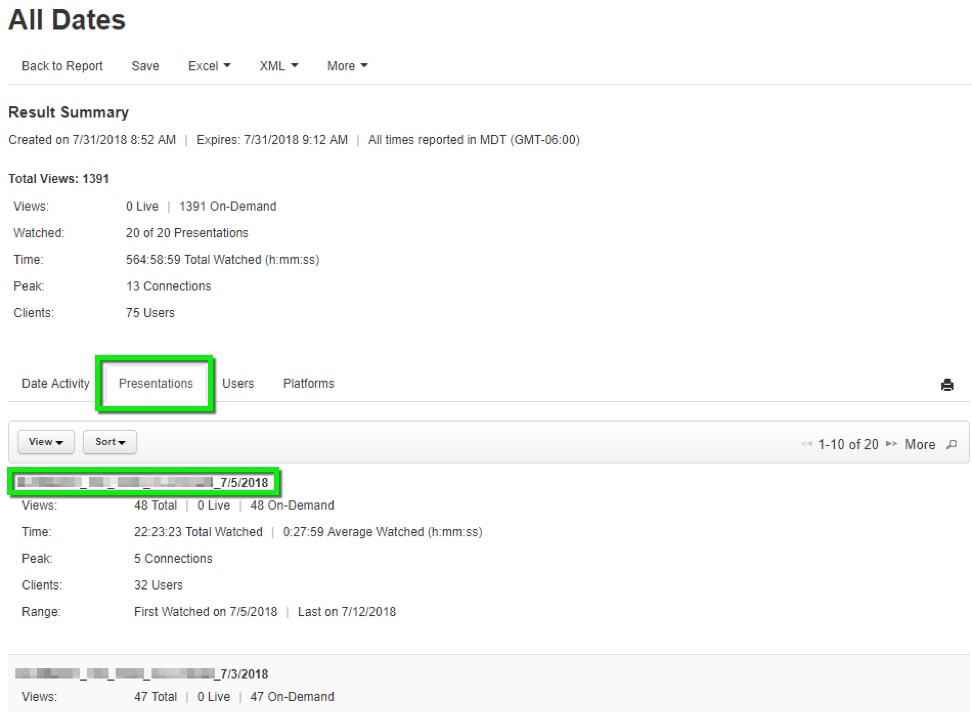
Presentations
All recorded presentations within your catalog will be displayed in the Presentations tab. Use the navigation and search buttons on the right side to view all presentations. Select a Presentation title to open the Presentation Analytics View.
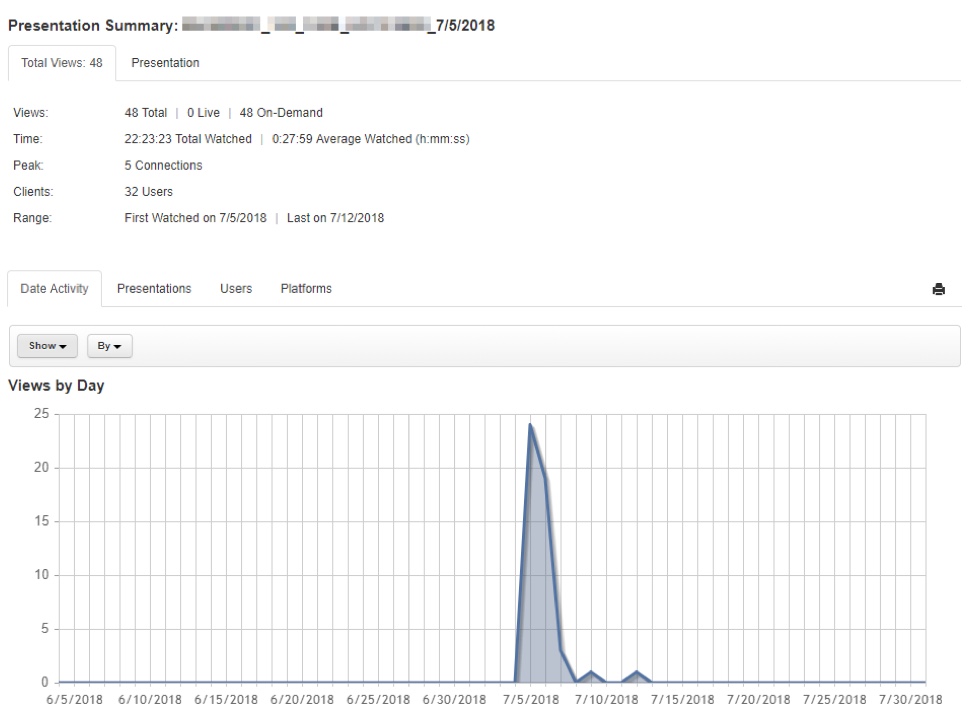
The Presentation Analytics View shows stats about a particular presentation as well as tabs including Date Activity, Users, Viewing Trends and Platforms. Plase note: These stats are only applicable to the individual presentation you selected.
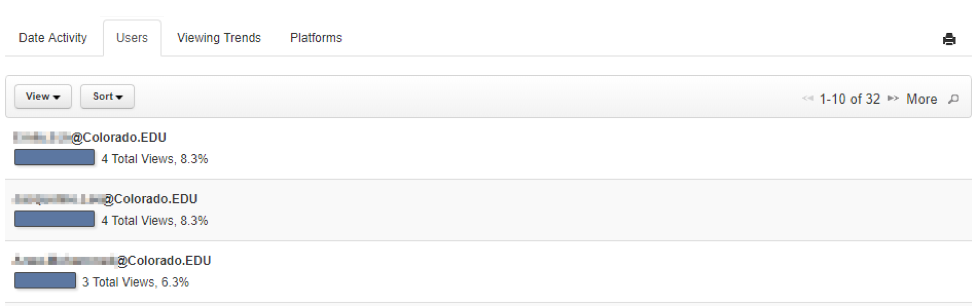
Users
The Presentation - Users tab shows individual user information including how many times they've viewed the presentation, and how long they watched.
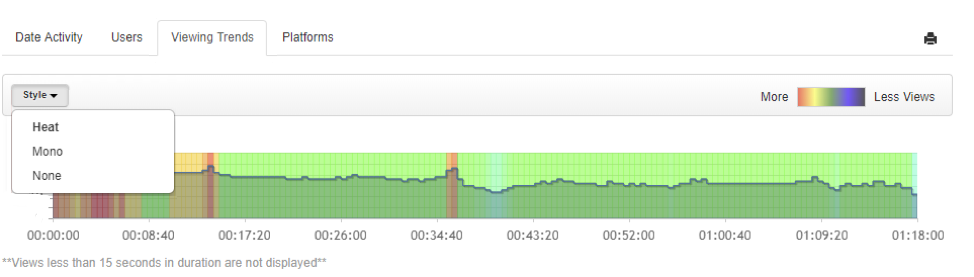
Viewing Trends
The Presentation - Viewing Trends tab shows a graph with data about viewer retention during the presentation. Click the Style drop down to change the properties of the graph.
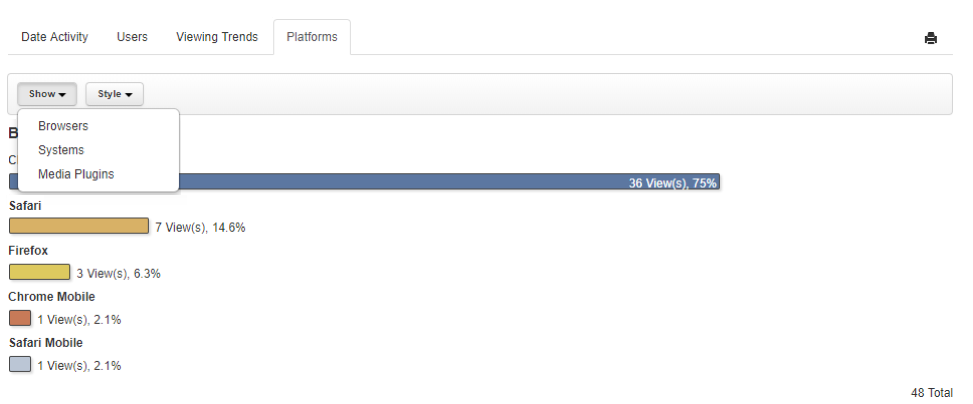
Platforms
The Presentation - Platforms tab shows information about browsers, systems and media plugins used to view that specific presentation. Click the Show or Style drop downs for more options.
Users
The Users tab allows you to find information about specific students’ viewing trends of all presentations. Click on an identikey to see their viewing pattern.
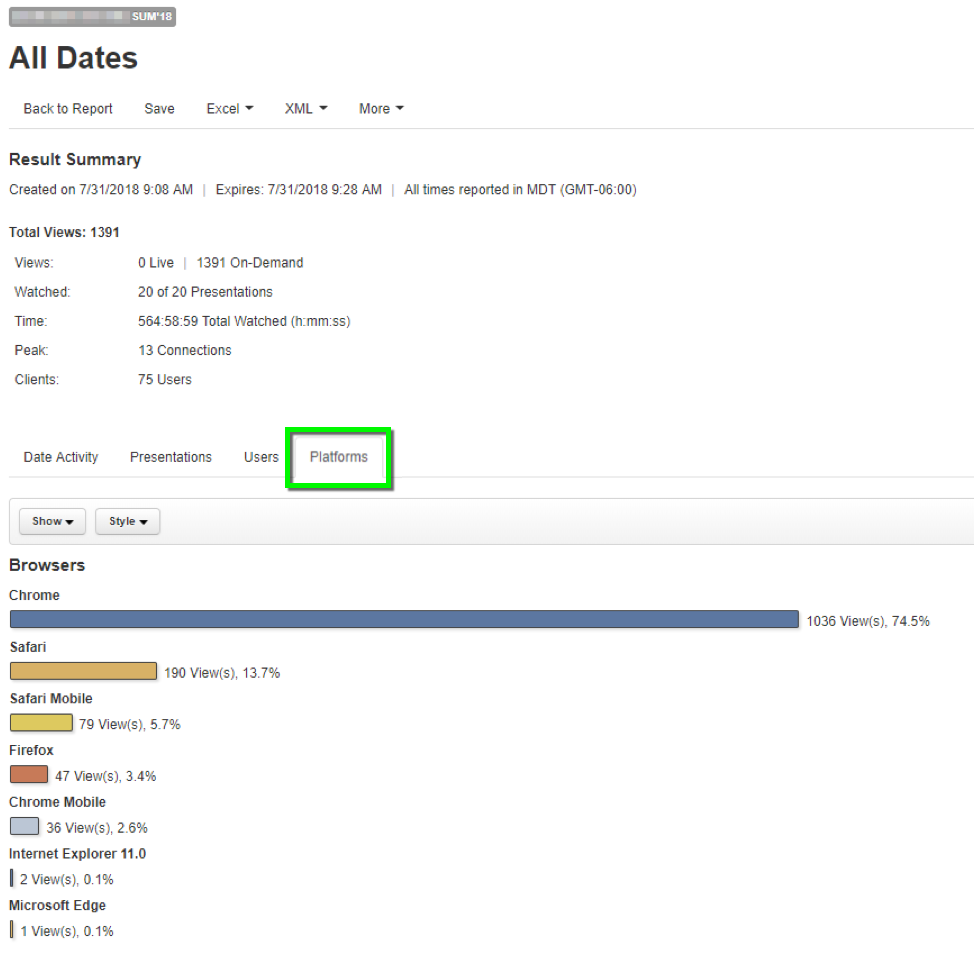
Platforms
The Platforms tab will show graphs explaining what tech students are using to watch videos across all presentations.
Glossary
Curious about what something means in analytic reports? Use our glossary below to learn more.
Analytic Reports Glossary
| Report Data | Definition |
|---|---|
| Air Date | Date and time presentation was made available for viewing. |
| Average Time Watched | Average total time watched per view. Example: A user opens a presentation and watches the first 30 minutes of a presentation, pauses the video, seeks back to the start and watches for 40 minutes. The user spent a total of 70 minutes watching the presentation (total time watched). If that was the only view for the user, the user’s average time watched would be 70 minutes. If the user logged in again and watched the first 30 minutes again, the average time watched for that user would be 50 minutes, i.e. (70 + 30) / 2 = 50 minutes. |
| Browsers | Browsers (Chrome, IE, Firefox, Safari) used to view presentation (s). Total views shown are the number of time presentation(s) were watched live and on-demand using a particular browser. |
| Duration | The presentation's length (h:mm:ss). |
| End | End date and time for time period over which an activity is being measured (total views, presentations authored, etc.) |
| First Watched | Date and time that the presentation was first watched. |
| Folder | Mediasite folder in which the presentation is located. |
| Last Watched | Date and time that a presentation was last watched. |
| Live Views | Total number of times that a presentation was viewed live. |
| Media Plugins | Media Plugins (HTML5, Flash, Silverlight, Unknown) used to view the presentation. Total views shown are the number of time a presentation was watched live and on-demand using a particular media plugin. |
| On-Demand Views | Total number of times presentation (s) was viewed on-demand. |
| Peak Connections | The highest number of concurrent views for a presentation. |
| Presentations Available | Total number of presentations. |
| Presentation Title | Title of presentation included in report. |
| Presentations Watched | Total number of presentations watched. |
| START HERE MAN Publish To Go Downloads | Total number of Publish to Go downloads. |
| Referrer | Method by which a presentation was accessed, server name or a direct link. |
| Session Type | How user viewed a presentation: live or on-demand. |
| Shortcuts Authored | The number of presentation shortcuts created by presenter(s). |
| Shortcut Title | Title of shortcut included in report. |
| Start | Start date and time for time period over which an activity is being measured (total views, presentations authored, etc.) |
| Systems | Systems (Windows 10, Windows 8, Windows 7, Mac OS X, iPad, etc.) used to view a presentation. Total views shown are the number of times a presentation was watched live and on-demand using a particular system. |
| Time Watched | The amount of time (h:mm:ss) a user watched a presentation. If a user goes back and forth in a presentation, the time watched can be longer than the presentation. Example: A user opens a presentation and watches the first 30 minutes of a presentation, pauses the video, seeks back to the start and watches for 40 minutes. The total time user spent watching the presentation is 70 minutes. |
| Total Authored | The total number of presentations created by the presenter. |
| Total Content | The amount (h:mm:ss) of content created by or featuring the presenter. |
| Total Downloads | Total number of Publish to Go and MP3 downloads. |
| Total Presentations | Total number of presentations included in report. |
| Total Presenters | Total number of presenters included in report. |
| Total Referrers | Total number of unique websites from which users launched the presentation. |
| Total Time Watched | The total amount of time (h:mm:ss) users spent watching the selected presentations. |
| Total Users | The total number of unique users who watched the presentation. |
| Total Views | The total number of times the presentations specified in the report were watched (includes live and on-demand views). |
| Username | Mediasite username used to view a presentation. |
| % Watched | The amount of presentation watched by user(s) in percentage. Example: A user opens a presentation and watches the first 30 minutes of a 60 minute presentation, pauses the video, seeks back to the start and watches for 40 minutes. The total time covered is 40 minutes so the percentage covered is 67%. |